
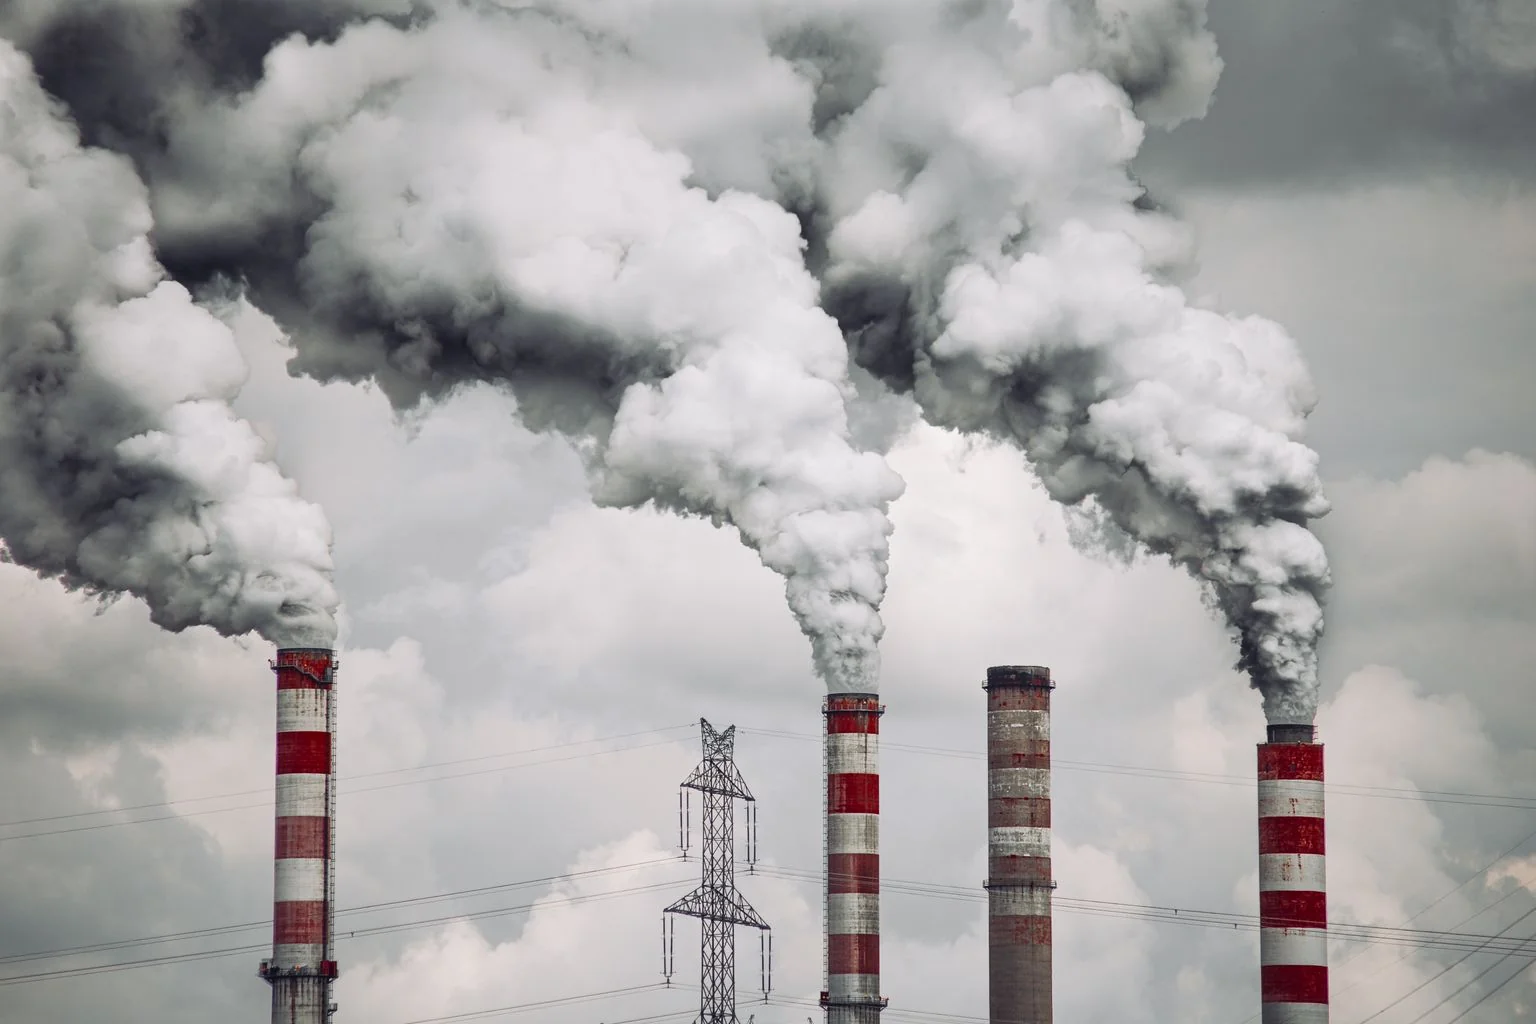
Measure Carbon Emissions in iGaming
A carbon footprint is the total greenhouse gas emissions associated with an activity, person, household, product or organisation, expressed as carbon dioxide equivalent (CO₂-e). For a New Zealand household, the biggest opportunities may lie in car travel, flights, heating and food. For a business, they may be diesel, purchased electricity, refrigerant leaks, freight or the goods it buys. Start by deciding what to count, collecting activity data and finding the largest sources.
Practical rule: calculate a baseline, identify the top two or three emissions hotspots, choose reductions you can control, then recalculate using a consistent method. Without a reporting period and clear boundaries, the number is hard to interpret.
What is included in a carbon footprint?
Carbon dioxide (CO₂) from burning petrol, diesel, coal or natural gas is only part of the picture. Methane (CH₄) from livestock and waste to landfill, nitrous oxide (N₂O) from soils and fertilisers, and fluorinated gases such as hydrofluorocarbons (HFCs) used in refrigeration also contribute to climate change. Their different warming effects are converted into carbon dioxide equivalent using a stated global warming potential (GWP) assessment period, commonly 100 years (GWP100).

A carbon footprint can include direct emissions from fuel combustion and leaking refrigerants and indirect emissions from electricity generation, supply chains, transport and disposal. Different boundaries produce different totals. A journey measured only at the exhaust pipe has a narrower boundary than one that also counts producing fuel and manufacturing the vehicle.
Gross emissions describe releases before removals or certain accounting adjustments. Net emissions account for relevant removals, such as carbon sequestration in forests, under a specified method. Neither term should be confused with a claim of carbon neutral or net zero . The claim needs a stated scope, evidence of reductions and an explanation of residual emissions. Carbon credits do not remove emissions from the original activity.
Why New Zealand footprints are different
In Aotearoa New Zealand, agricultural methane and nitrous oxide matter alongside energy emissions. Much of the electricity comes from hydro, geothermal, wind and solar generation. Transport, industrial heat, manufacturing, forestry and land-use change remain important. A low-carbon electricity mix does not erase the emissions from petrol vehicles, domestic aviation, dairy farming or imported goods.

In the year ended June 2026, renewable sources supplied 93.0% of New Zealand's electricity generation , according to Stats NZ. An annual national share does not make every kilowatt-hour emissions-free. Dry hydro conditions, gas and coal generation and changing demand can affect electricity emission factors. For the June 2026 quarter, seasonally adjusted total emissions from industries and households fell 2.9% compared with the preceding quarter; a single quarter does not establish a lasting trend. Source: Stats NZ, 21 October 2026 .
Different official datasets answer different questions. The New Zealand Greenhouse Gas Inventory reports the national inventory under international accounting rules. Stats NZ's industry and household accounts organise emissions around economic activity. A production-based measure counts emissions produced within an economy, while a consumption-based footprint allocates emissions through final demand, including those embodied in imports. They measure different boundaries, so their totals are not interchangeable.
How to calculate a carbon footprint
The basic calculation is:
Emissions (kg CO₂-e) = Activity data × Relevant emission factor.
Activity data may be litres of fuel, kWh of electricity, kilometres travelled, tonnes of freight, kilograms of material or volume of waste. An emission factor converts each unit of activity into estimated greenhouse gas emissions. A factor needs to match the unit, location, year, gases and boundary being measured.
- Set a boundary and a period. Decide whether you are measuring a person, household, workplace, product or event and whether the assessment covers one month, a calendar year or a product's full life cycle. Record any exclusions.
- Collect evidence. Use electricity bills, vehicle fuel records, flight itineraries, freight invoices, purchasing records, refrigerant service logs and waste reports where relevant. Actual quantities are usually more informative than dollar amounts.
- Choose NZ-specific emission factors. The Ministry for the Environment's Measuring Emissions Catalogue 2026 includes factors for fuels, refrigerants, purchased electricity, business travel, freight, wastewater, materials and waste, and agriculture, forestry and other land use (AFOLU). Record the catalogue version used.
- Calculate and classify. Multiply each activity by the appropriate factor, convert units consistently, and sum the results in kg or tonnes CO₂-e. For an organisation, assign each source to an applicable reporting scope.
- Test the result. Check unusually high values, missing activities, duplicated journeys and whether the electricity factor already includes the relevant emissions. Flag estimates and data gaps.
- Set a baseline. Retain the year, method, organisational boundaries and assumptions so future comparisons show real operational changes rather than accounting changes.
Diesel and electricity: a calculation example
Suppose a small business records 2,400 litres of diesel in a year. Its fuel emissions are 2,400 litres × the applicable NZ diesel factor (kg CO₂-e per litre) . If the same business uses 18,000 kWh of purchased electricity, calculate that separately using the appropriate electricity factor. Add them only after checking that both factors use compatible boundaries. These are example activity quantities, not estimated emissions.
For early planning, a spend-based calculation may estimate emissions from procurement costs using input-output analysis. It is useful when suppliers cannot provide quantities, but prices fluctuate and averages can hide the difference between two products. Prefer activity-based calculation , supplier-specific data or a verified Environmental Product Declaration (EPD) where decisions depend on product-level accuracy.
Scope 1, 2 and 3: emissions in a business
The GHG Protocol separates emissions into three scopes. This matters because two apparently similar businesses may report different totals if one excludes its value chain.
Business footprints often combine direct fuel use, purchased electricity and value-chain activity in one reporting system.
| Scope | What it covers | New Zealand example |
|---|---|---|
| Scope 1 | Direct emissions from sources owned or controlled by the organisation. | Diesel company vehicles, gas boilers, refrigerant leaks. |
| Scope 2 | Indirect emissions associated with purchased electricity, heat, steam or cooling. | Electricity used by an office, warehouse or production facility. |
| Scope 3 | Other indirect emissions across the value chain, both upstream and downstream. | Purchased goods, freight, business flights, employee commuting, product use and end-of-life treatment. |
Scope 3 is organised into 15 categories in the GHG Protocol's value-chain framework. Upstream emissions can include purchased goods, capital goods and inbound transport; downstream emissions can include distribution, use and disposal of sold products. Different companies can legitimately report the same physical emissions in different scopes: that is not automatically an error. However, a company should avoid double-counting the same activity within its own inventory.
Define organisational boundaries (which entities and operations are included) separately from reporting boundaries (which emission sources and scopes are included). ISO 14064-1 supports organisational greenhouse gas inventories; a GHG inventory documents sources, methods and assumptions, not just one headline number. Formal GHG reporting or third-party verification may be appropriate for procurement requirements, public claims or higher-risk disclosures.
Personal and household carbon footprints: where to act first
For households, repeated car journeys, flights and major purchases are often more consequential than small symbolic swaps. Tools such as FutureFit can help estimate a personal or household footprint and compare lifestyle choices, although estimates depend on the answers and assumptions supplied.
Transport and flying
Road transport is a strong place to check for households using a petrol or diesel vehicle regularly. Compare yearly distance, vehicle fuel consumption and alternatives such as public transport, cycling, walking, trip combining or remote work. An electric vehicle can reduce operational emissions, especially when charged on a relatively low-emissions grid, but battery manufacturing, electricity supply and vehicle size still matter to the full life-cycle footprint. Availability of EV charging, budget and actual travel needs should determine whether switching is sensible.
Business flights and domestic aviation can contribute a disproportionate amount for frequent travellers. Distinguish direct flight emissions from any methodology that adds non-CO₂ aviation effects; calculators may not use the same assumptions. Replacing an avoidable flight with a video meeting changes the activity itself. Offsetting the same flight does not.
Home electricity and heating
Check insulation, draft proofing, efficient appliances, smart meters and heating controls before investing in new equipment. Heat pumps can deliver space heating efficiently, while electrification can replace fossil-fuel heating in suitable homes. Solar power may reduce purchased electricity but does not automatically make a home carbon neutral: panel manufacture, the timing of generation and any grid imports still count under a full lifecycle assessment. Prioritise safety, comfort and actual energy savings.
Food, shopping and waste
Food consumption has emissions from agriculture, land use, processing, packaging and distribution. Red meat and dairy can have substantial methane-related footprints, but outcomes vary by production system, serving size and method. Cutting avoidable food waste, reviewing the balance of meals and purchasing durable goods can be practical starting points. Recycling can support a circular economy, but preventing unnecessary production or extending product life may avoid more upstream emissions than managing waste after purchase.
Landfill methane, wastewater and disposal routes should be included when material to the footprint. Avoid assuming a single recycling label or “local” origin guarantees the lowest footprint: farming methods, product longevity and freight mode may have greater effects than distance alone.
Product carbon footprints: why life-cycle boundaries matter
A product carbon footprint measures climate impacts across a defined product system using Life Cycle Assessment (LCA) principles. A cradle-to-grave assessment can include raw material extraction, manufacturing, transport, use and end-of-life disposal. A narrower cradle-to-gate estimate stops at the factory gate. Comparing one product's cradle-to-gate figure with another product's cradle-to-grave figure can produce a false winner.
Life Cycle Inventory (LCI) collects inputs and outputs; Life Cycle Impact Assessment (LCIA) translates them into environmental impact indicators. ISO 14067:2018 provides requirements and guidance for product carbon footprints. For complex comparisons, an Environmental Product Declaration may provide externally verified information, although the declared unit, product category rules and life-cycle boundary still need checking. The Life Cycle Association of New Zealand (LCANZ) explains core terminology.
Buildings illustrate the distinction between operational carbon from heating, cooling and electricity use and embodied carbon from construction materials, manufacturing, transport and construction. The New Zealand Green Building Council (NZGBC) and building-sector guidance are relevant when evaluating design and procurement. The lowest-operational-energy design is not necessarily the lowest whole-of-life option if initial material impacts are much higher.
Technology that helps measure and reduce emissions
A dashboard can identify emissions hotspots; it cannot cut emissions on its own. The useful tools connect energy, travel or purchasing records to decisions that change those activities.
Digital tools are useful when they improve data quality, reveal hotspots and support measurable operational decisions.
- Carbon footprint calculators: suitable for an initial estimate. Business.govt.nz's Climate Action Toolbox and FutureFit serve different organisational and personal use cases.
- Emissions management software: brings together activity data, emission factors, approval history and a digital emissions dashboard. Check whether factors are appropriate for New Zealand and whether reports preserve a transparent audit trail.
- Smart meters and energy analytics: identify consumption peaks, equipment running out of hours and possible efficiency improvements. Measured kWh savings must be translated with appropriate factors before claiming emissions savings.
- Cloud computing and data centres: can add indirect digital emissions through electricity demand, equipment and infrastructure. Tools such as Google Cloud Carbon Footprint, Microsoft's Emissions Impact Dashboard and the AWS Customer Carbon Footprint Tool offer provider'specific estimates. Their allocation methods and coverage differ; avoid combining their outputs without checking boundaries.
- Electrification and fuel switching: replacing fossil-fuel industrial heat or vehicle fleets with suitable electric alternatives can reduce direct combustion emissions. Check total cost, grid demand, duty cycle and whether new equipment introduces other impacts.
- Supply-chain platforms: can gather supplier activity data and support sustainable procurement, but a supplier's claimed carbon neutral status is not a substitute for understanding the purchased product's actual footprint.
Sector-specific tools matter too. Greenlit offers a carbon calculator for film production; companies with large freight or tourism footprints require better travel and logistics data than a generic office calculator provides. The Energy Efficiency and Conservation Authority (EECA) provides guidance for measuring emissions, while the Ministry of Business, Innovation and Employment (MBIE) publishes energy information useful for interpreting electricity and fuel trends.
How to choose the highest-impact reduction
Rank reduction options by tonnes CO₂-e avoided , feasibility, cost, time and uncertainty. First avoid unnecessary activity, then improve efficiency or replace high-emissions fuels and materials. Address hard-to-abate residual emissions separately.
| Main emissions source | Consider first | Verify with |
|---|---|---|
| Petrol or diesel travel | Fewer vehicle kilometres, route optimisation, efficient fleet or suitable EVs | Litres of fuel and kilometres per year |
| Heating and process fuel | Insulation, efficiency, heat pumps or electrification | Metered fuel use and output or comfort level |
| Purchased goods | Buy less, extend service life, compare lower-impact suppliers and materials | Quantities, EPDs and supplier-specific factors |
| Freight transport | Shipment consolidation, modal changes and logistics redesign | Tonne-kilometres and freight records |
| Waste and food | Prevention, reuse, appropriate recovery and disposal | Waste weights and destination data |
Businesses should set carbon reduction targets against the baseline year and assign owners to material initiatives. Track absolute emissions alongside an intensity measure, such as emissions per unit manufactured, so a growing business does not mistake efficiency improvement for a fall in total climate impact. Avoid claiming a reduction when the apparent change was caused by a different emissions factor, missing data or a change in reporting boundary.
Carbon offsets, net zero and greenwashing
A carbon offset or carbon credit represents a claimed mitigation outcome under a specific programme. Assess additionality, permanence, leakage, double counting and independent verification. Forestry may store carbon in a carbon sink, but wildfire, harvesting and land-use change can affect that storage. Emission reductions within an operation and carbon removal outside it are not interchangeable physical events.
New Zealand's Emissions Trading Scheme (NZ ETS), emissions budgets and Emissions Reduction Plan shape national climate policy, while the Paris Agreement and New Zealand's Nationally Determined Contribution (NDC) provide international context. They do not make an individual product or organisation automatically compliant with a voluntary carbon neutral claim. Providers such as Ekos or Toitū Envirocare may offer carbon accounting or certification services; review the exact standard, scope and assurance rather than relying on a logo.
Greenwashing warning signs include no baseline, no reporting year, an unclear claim boundary, selective omission of Scope 3, and language implying that offsets eliminate actual fuel emissions. Look for the boundary, measured reductions, remaining emissions and assurance details.
How to tell whether your footprint is genuinely falling
Organisations commonly recalculate their inventory each year. Compare like with like: the same reporting period, operational boundary, method, factor version where suitable, and similar activity level. Document any restatement of the baseline. A drop in fuel purchases caused by selling part of the business is not equivalent to decarbonising the retained operations.
Small reductions matter most when they change repeated behaviours and can be checked against actual fuel, energy or waste data.
For an action such as replacing a diesel boiler, record fuel consumption before the change, metered electricity or fuel after the change, operating output, weather or seasonal effects, and relevant emission factors. Report both absolute t CO₂-e and any useful performance measure. If an initiative relies on estimated savings, label them as estimates until verified against actual data.
Independent review becomes more valuable when a company makes customer-facing claims or supplies emissions figures to a larger purchaser. The Sustainable Business Network, EECA and the Ministry for the Environment can provide routes to locally relevant guidance, but the method and data still need to fit the organisation's own operations.
Common carbon footprint questions
What is a good carbon footprint per person in New Zealand?
A personal benchmark only makes sense when the calculator, household size and included activities are the same. Imported goods can shift the result substantially. Compare like with like, then examine the sources you can change.
Can a carbon footprint be zero?
Even activities with no exhaust can carry emissions from manufacturing, transport or disposal. Check whether a “zero” claim refers to operations, a product stage or a net balance involving removals or offsets.
Why do two carbon calculators disagree?
Different emission factors, electricity accounting methods, flight assumptions, data years and Scope 3 boundaries explain many disagreements. Read each calculator’s method before comparing the totals.
Should a small business measure Scope 3 immediately?
Start with an accurate view of direct fuel, refrigerants and purchased electricity, then screen the value chain to identify likely material categories. A freight-intensive importer or retailer may need Scope 3 early, whereas a small service operation can often begin with a simpler inventory and expand as reliable supplier data becomes available.
Does renewable electricity remove my carbon footprint?
No. Renewable electricity does not account for car fuel, food, materials, refrigerants or purchases. Generating equipment also has manufacturing and construction impacts in a life-cycle assessment.
A workable first-month plan
- Week 1: establish the boundary and reporting period; identify who owns the data.
- Week 2: gather electricity, fuel, travel, purchasing and waste records; note gaps.
- Week 3: calculate a baseline with documented NZ emission factors; check units and exclusions.
- Week 4: select the two most credible reduction actions, record how their impact will be measured, and set a review date.
For New Zealand organisations, the MfE emission-factor files and interactive workbook provide a reproducible starting point. For households, a calculator is a useful screening tool, but the better long-term evidence is whether fuel, energy and purchasing decisions actually change. Keep the baseline and return to the same records after changes have been made.